TAD visulization
Since 0.4.2, I’ve included a visulization module, mainly designed to customize triangular rotated heatmap and plot TADs/loops on it.
Main features:
cool file support
extract/manipulate coordinates of each contact in triangle shape
Basic Tutorial
First, let’s change to the data folder distributed with TADLib:
$ pwd

/Users/xtwang/workspace/MyPackages/TADLib/data
Then follow the commands below within a Python interpreter:
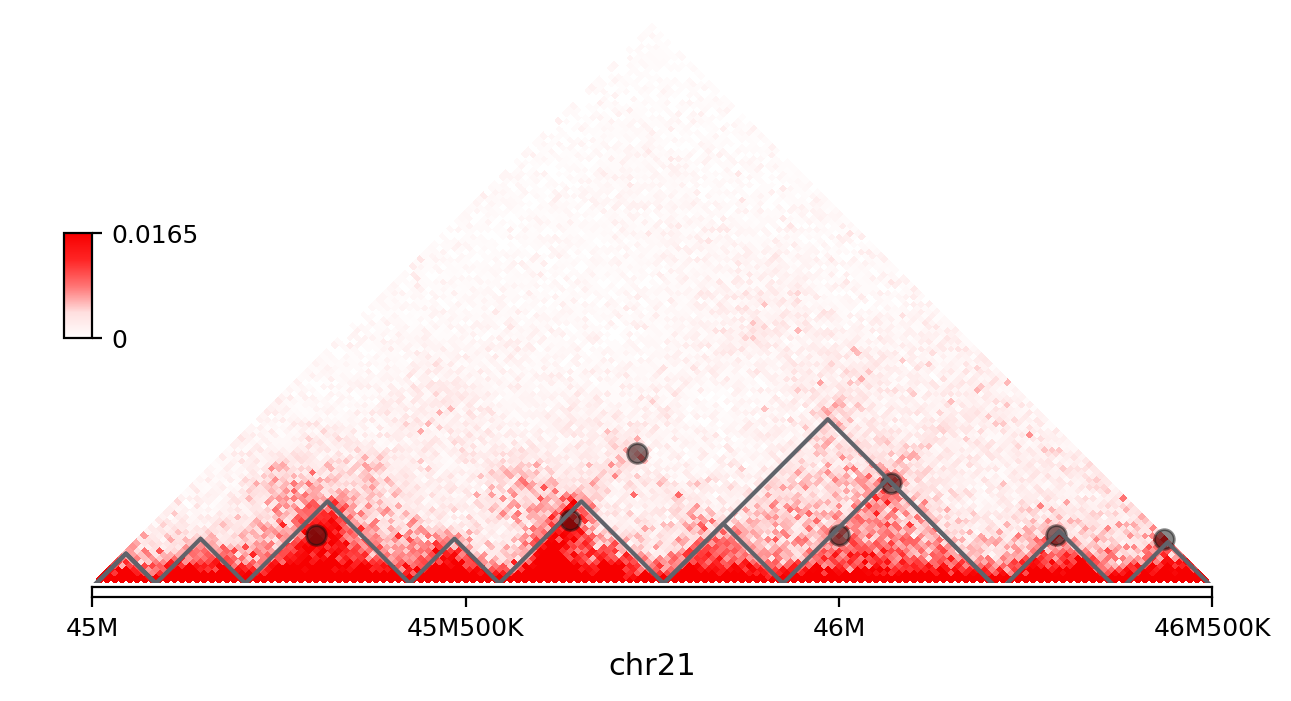
In [1]: from tadlib.visualize.heatmaps import *
In [2]: vis = Triangle('GM12878-MboI.hg19.cool::10000', '21', 45000000, 46500000)
In [3]: vis.matrix_plot()
In [4]: vis.plot_loops('GM12878-MboI.10K.peakachu.bedpe')
In [5]: vis.plot_TAD('GM12878-MboI.20K.HiTAD.txt', linewidth=1.5)
In [6]: vis.show()